▲ Broker Log Analysis & Strategy Tracker
BlastFin
Trade Smarter.
Track Everything.
Journal Every Trade. Blast Every Target.
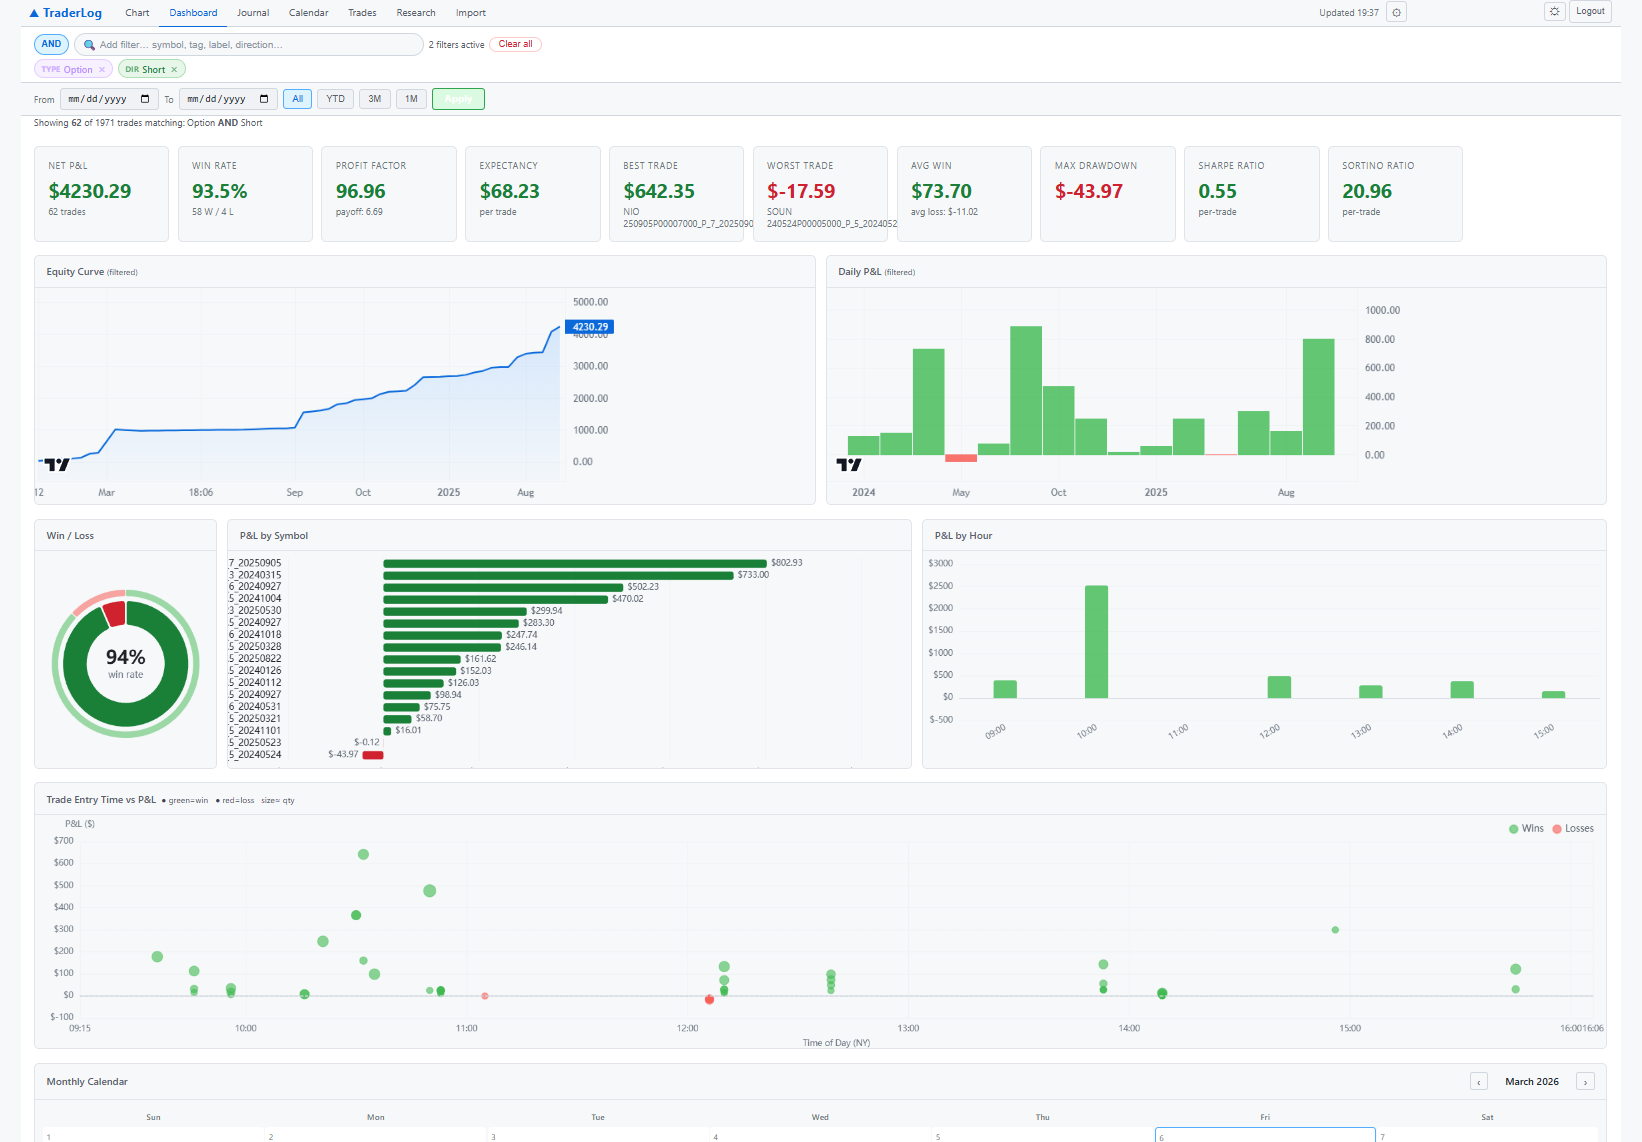
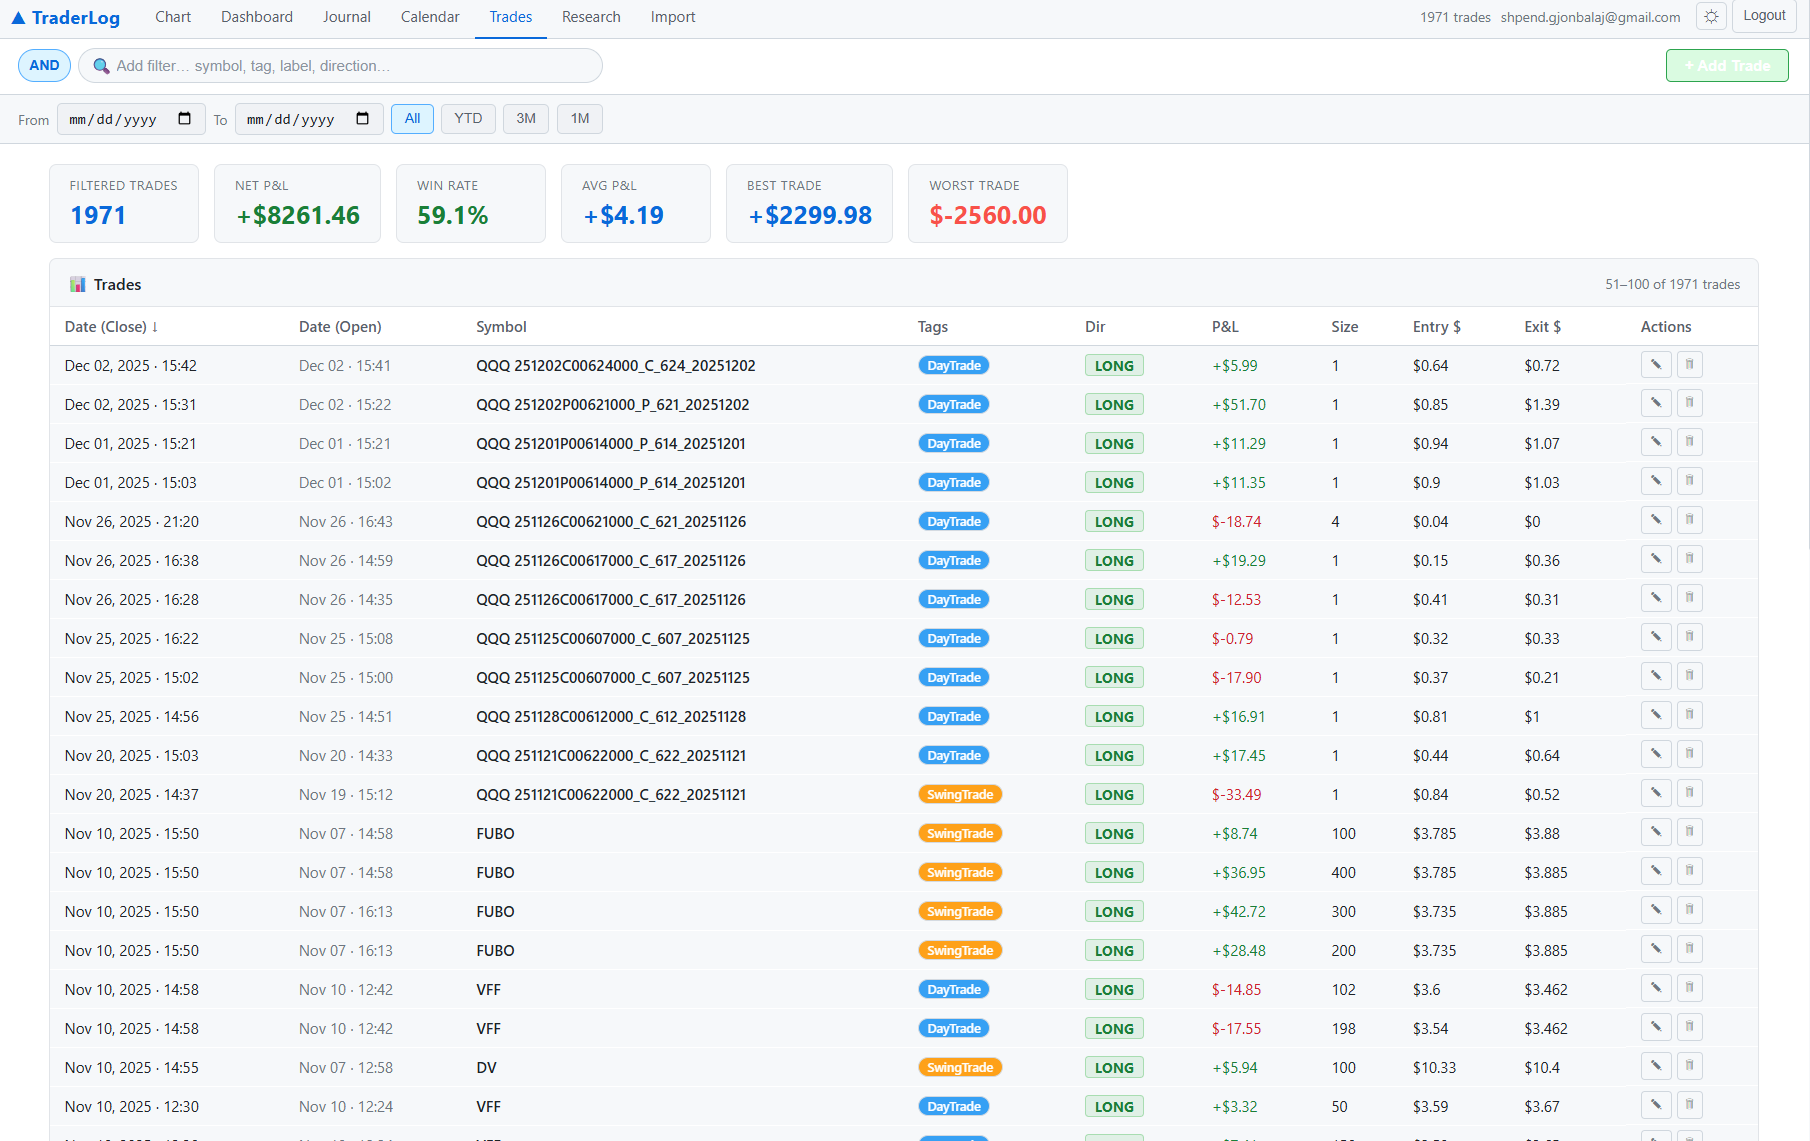
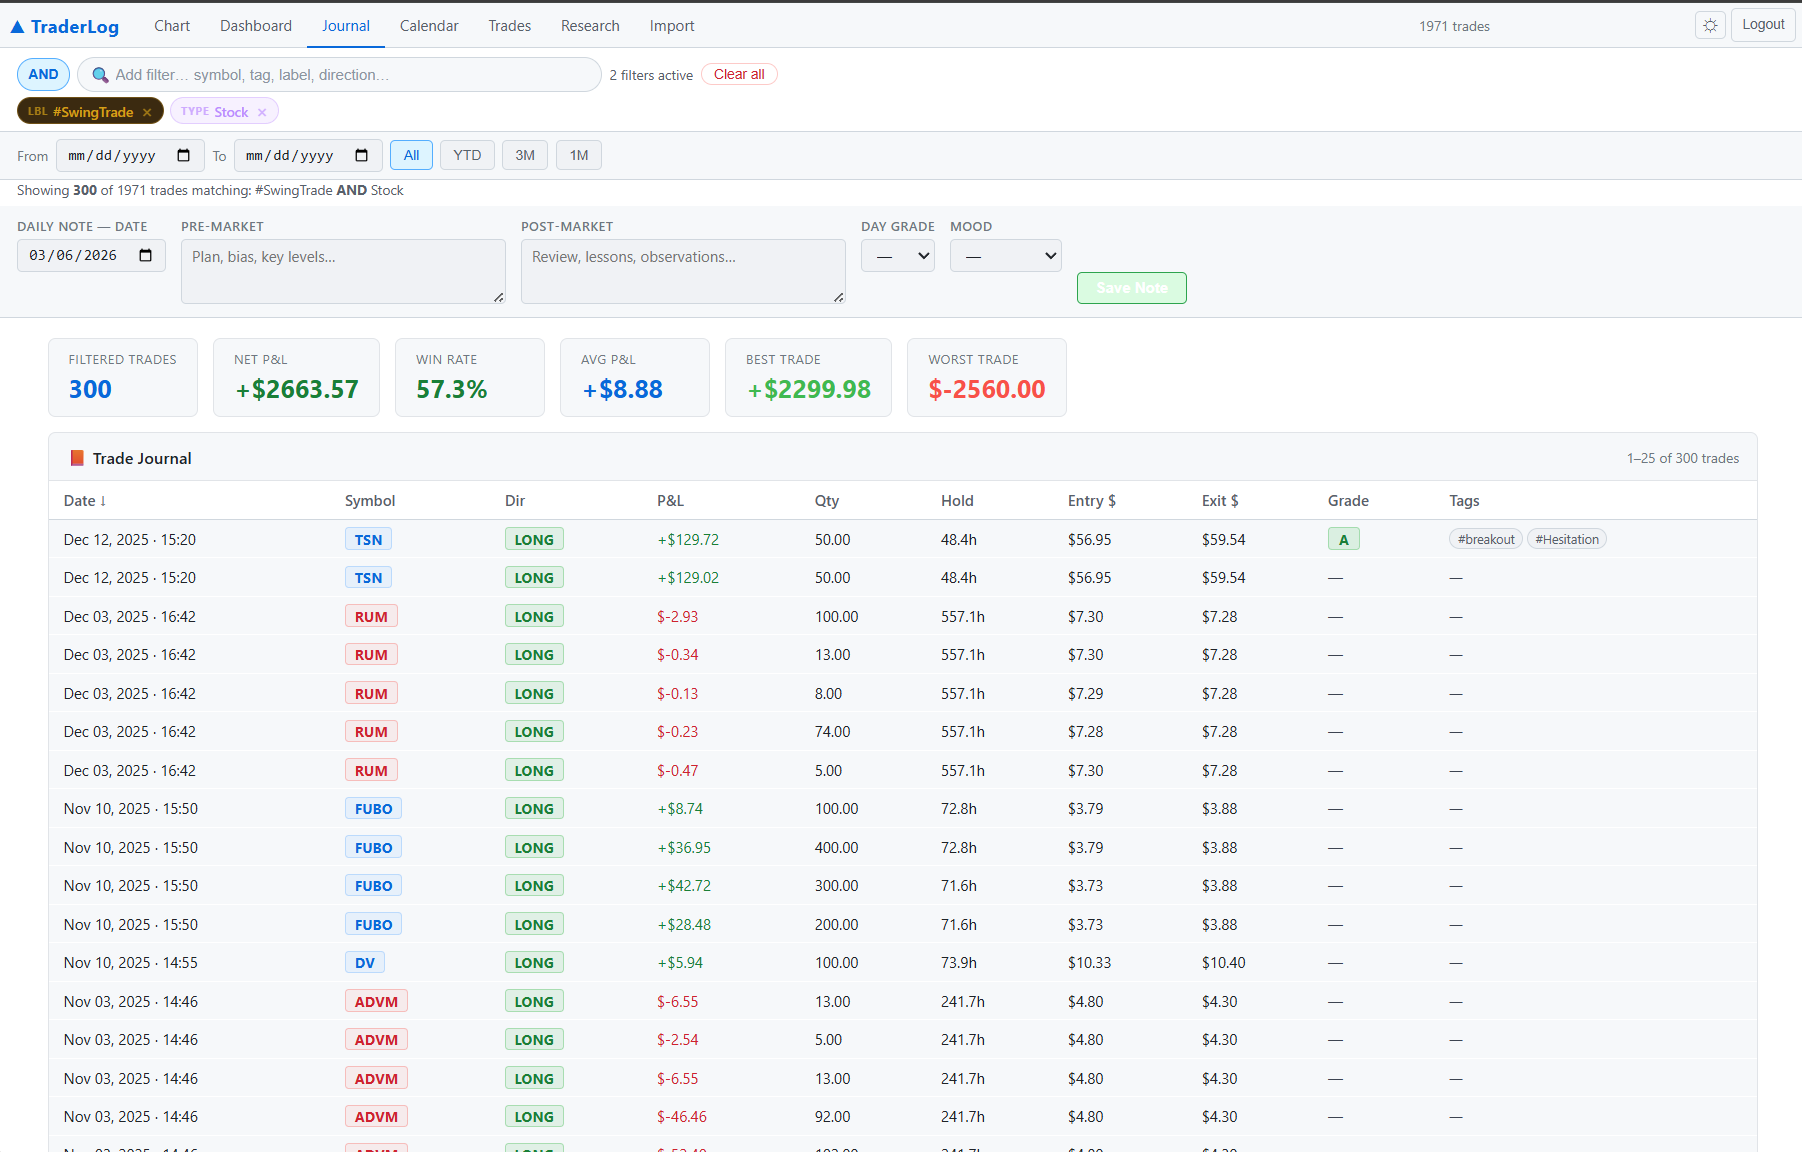
A professional trading journal and analytics platform. Import directly from your broker, analyze performance across 20+ metrics, and discover your true edge.
Stocks
Equities & ETFs
Options
Puts, Calls & Spreads
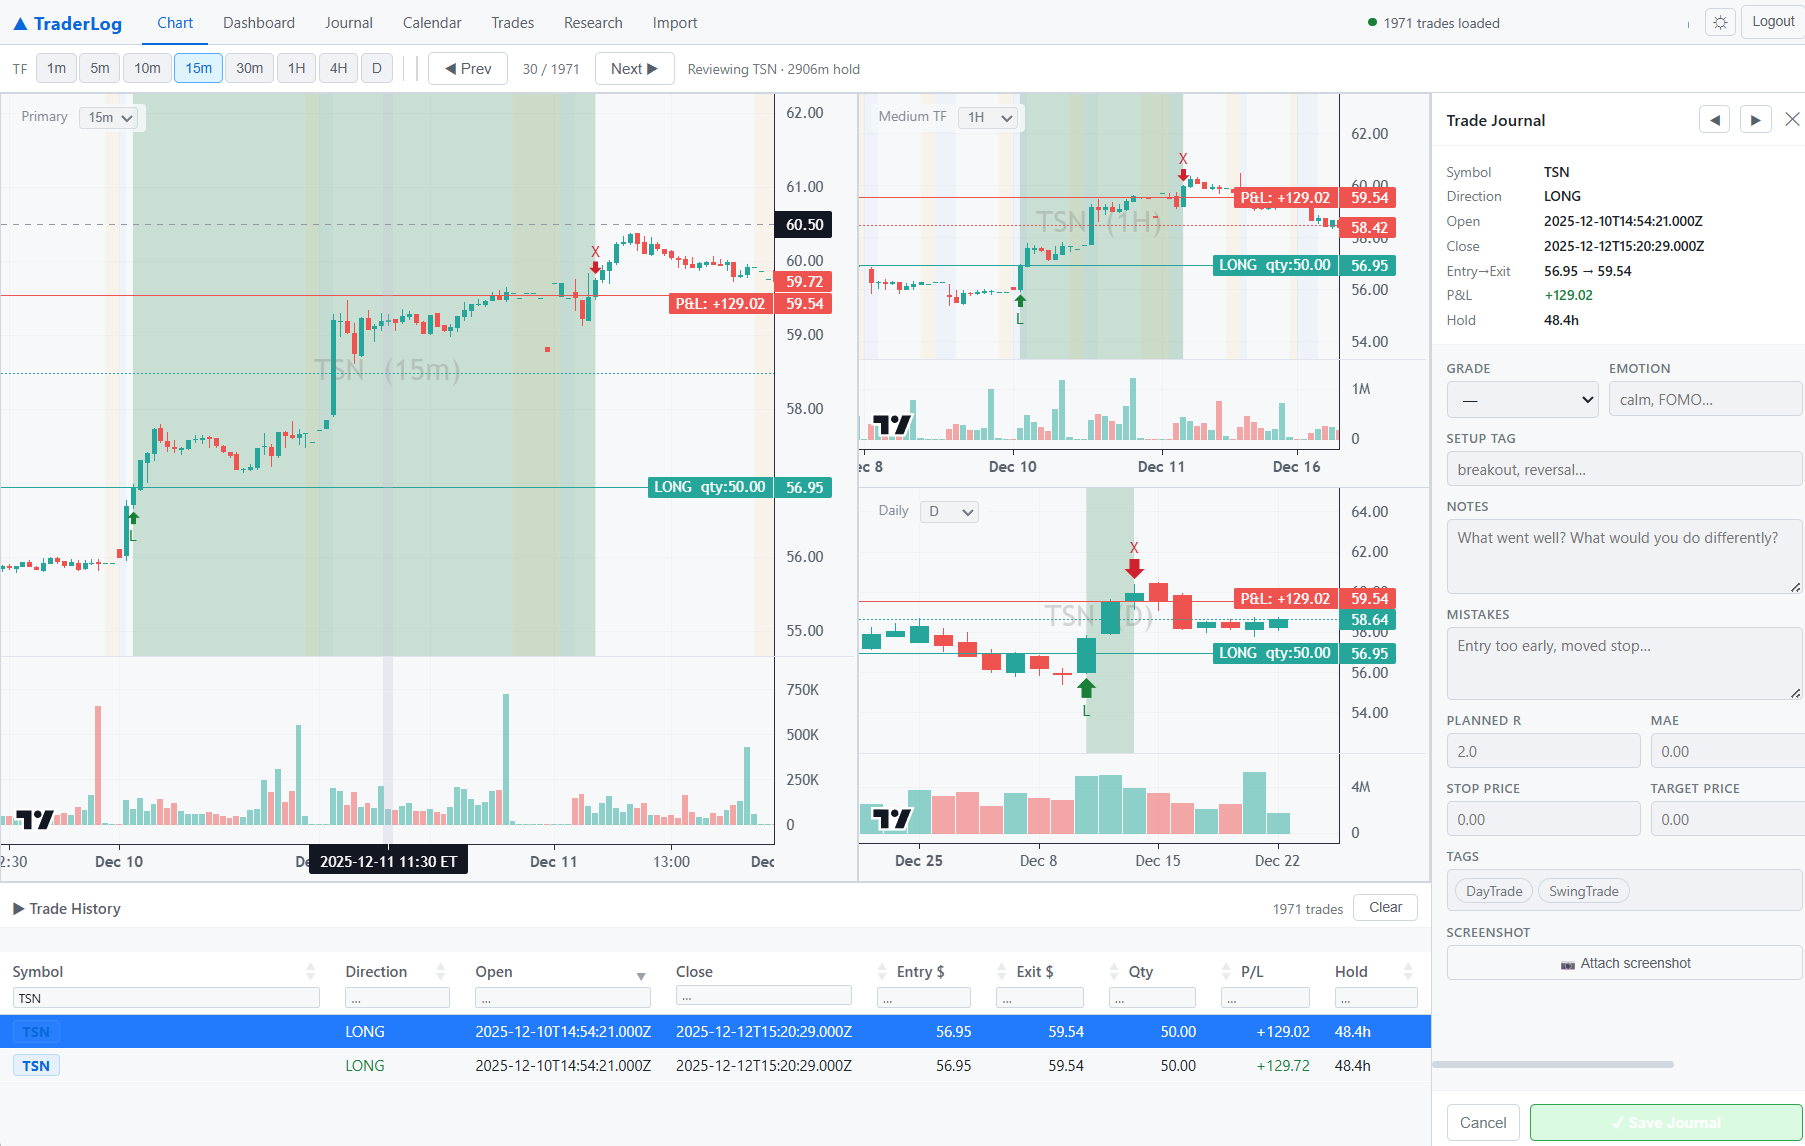
FIFO
Exact P&L Matching
20+
Performance Metrics
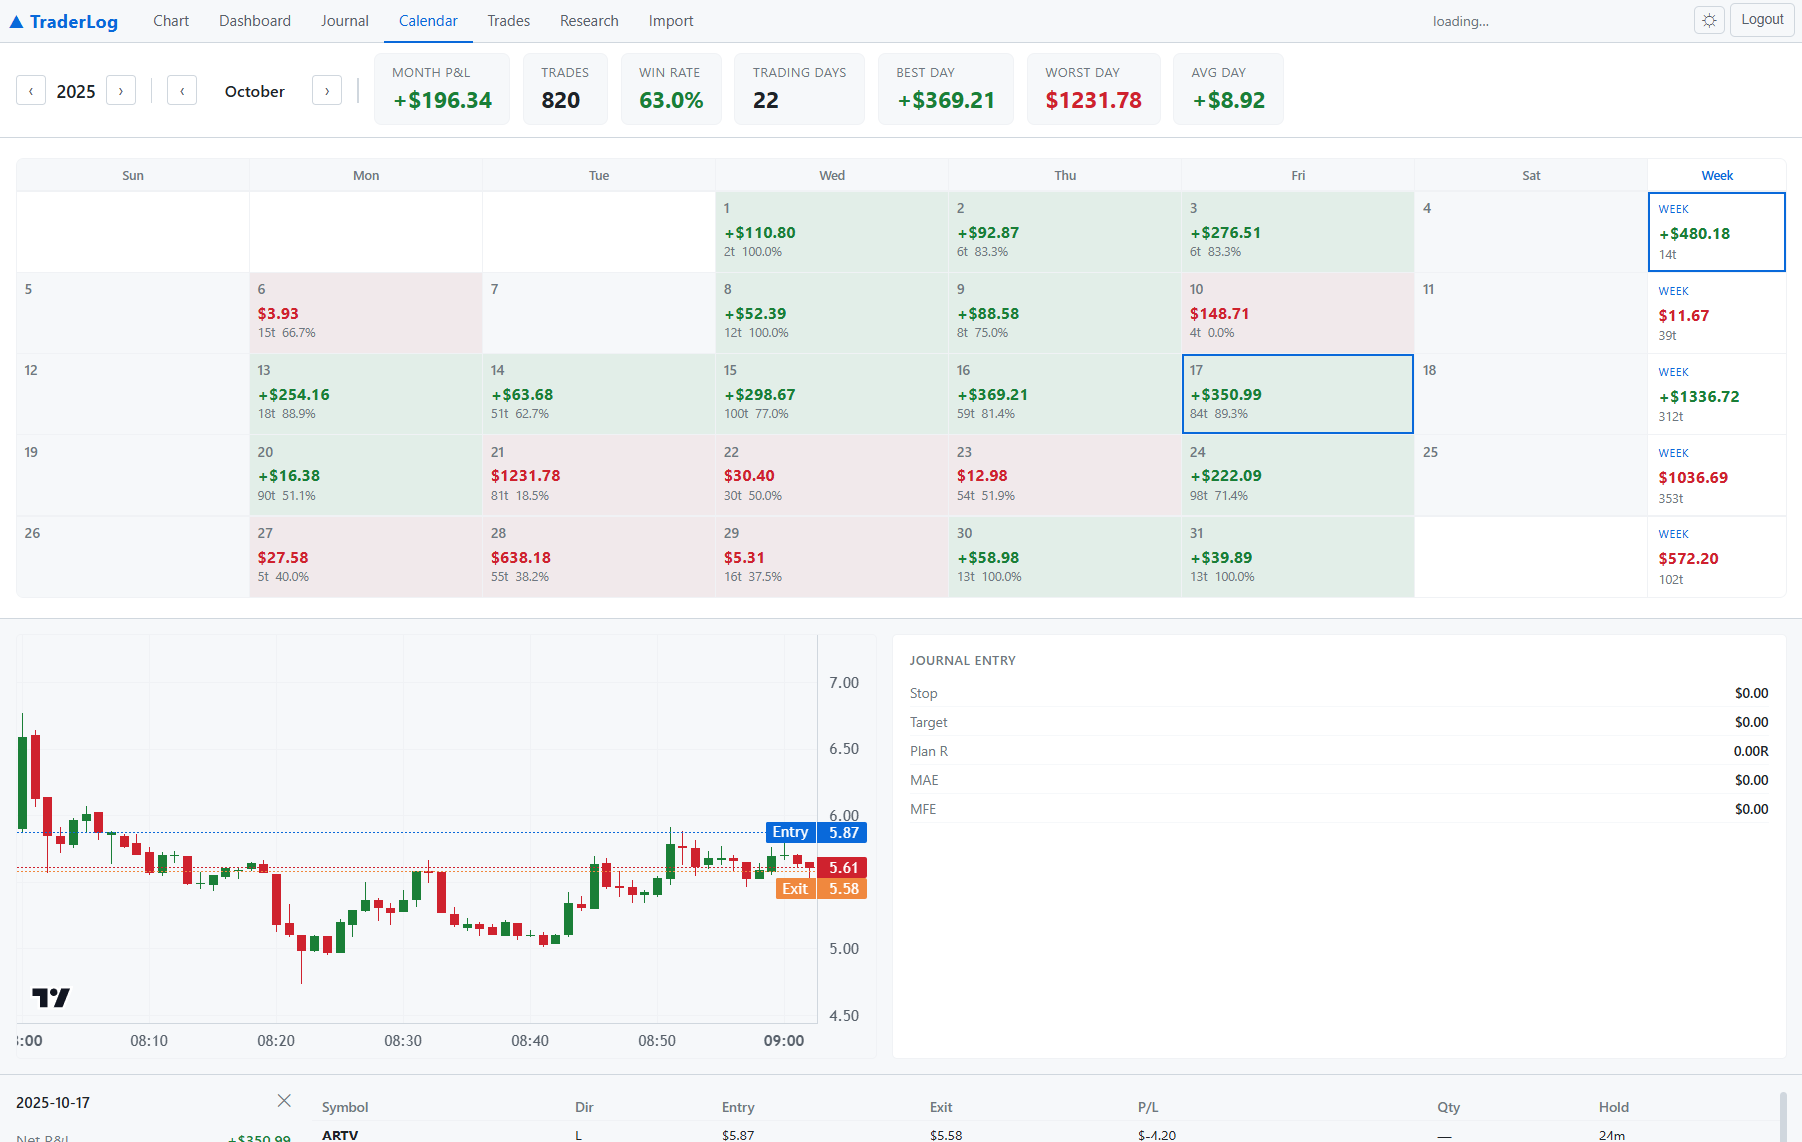
Any Range
1 Day to Years
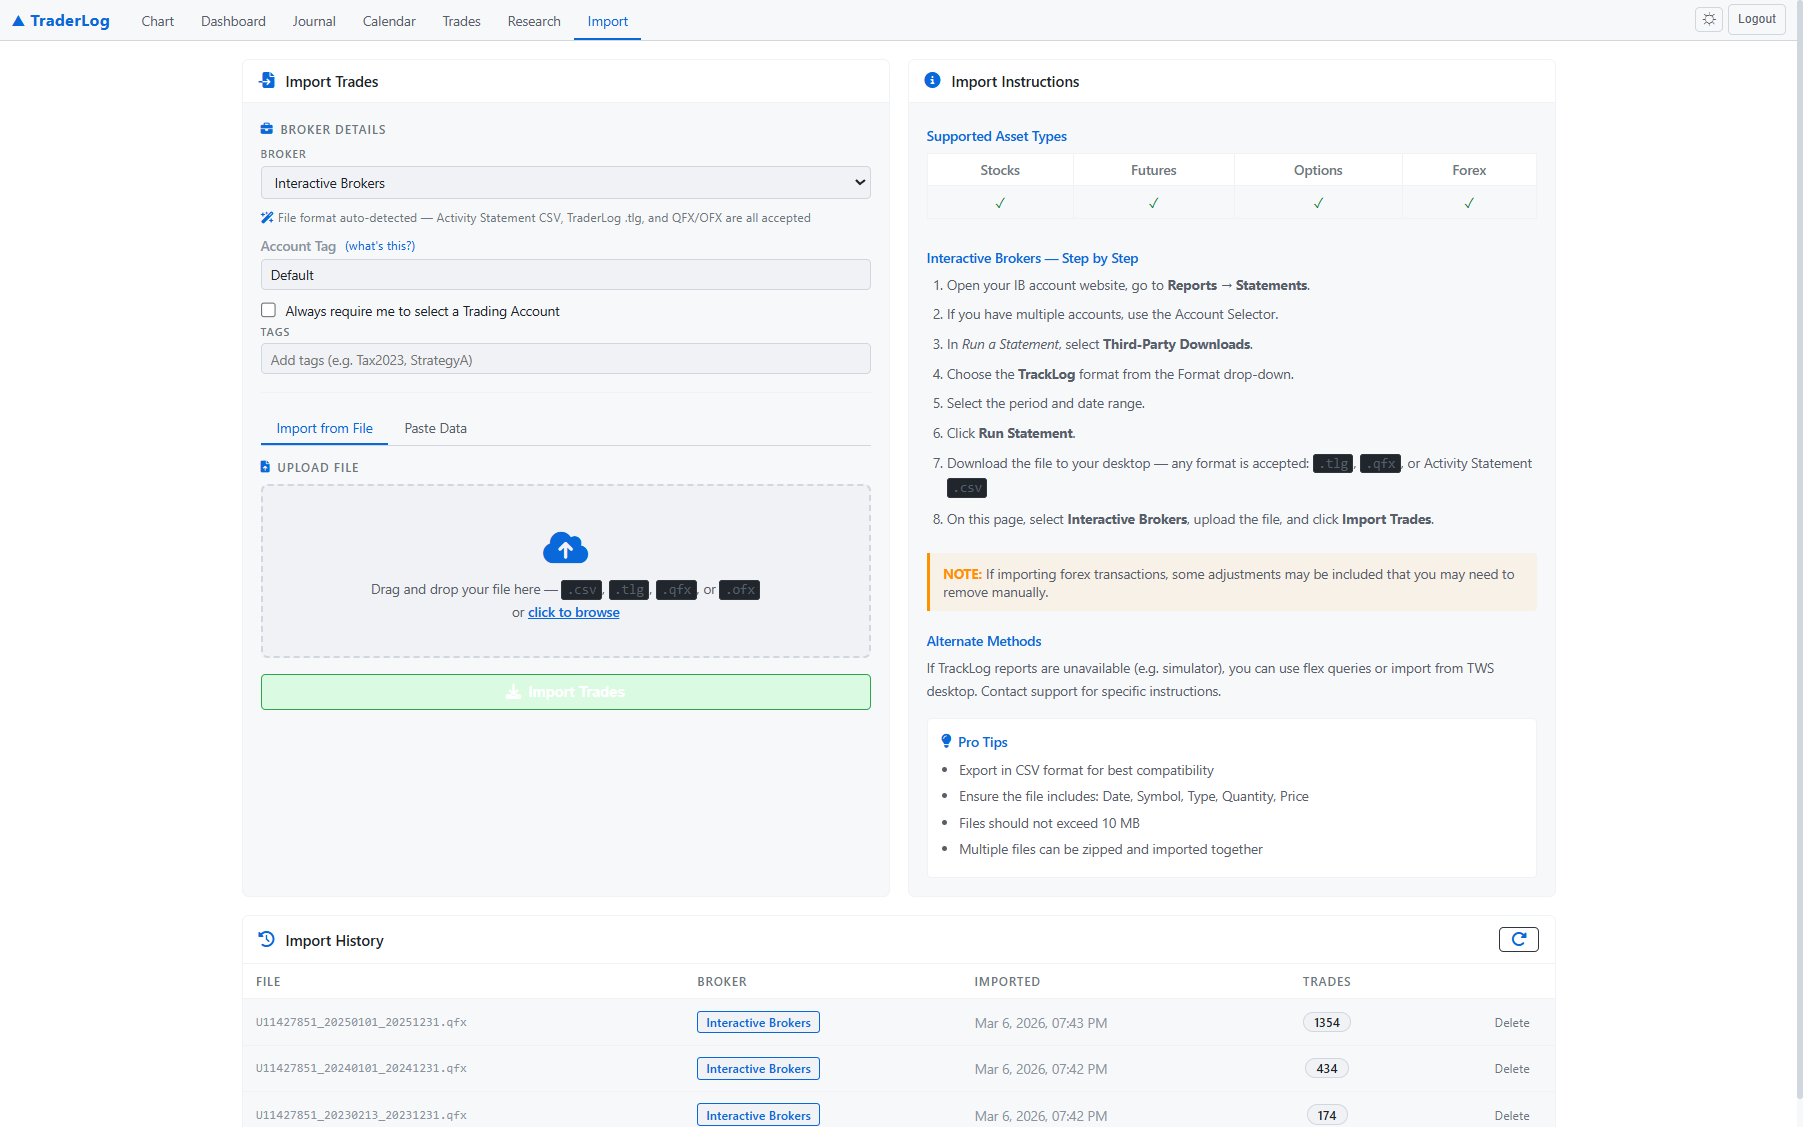
IB · More
Broker Formats